

|
|
PLANNED
VERSUS ACTUAL SPENDING BY AUTHORITY
PLANNED
VERSUS ACTUAL SPENDING BY PROGRAM ACTIVITY
2004-2005
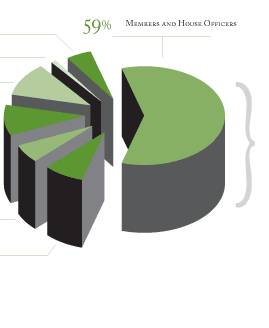
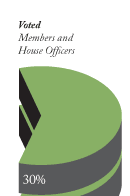
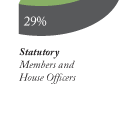
ACTUAL SPENDING BY SERVICE (BY PERCENTAGE)
INCREASE
IN MAIN ESTIMATES OVER PREVIOUS YEAR
FULL
TIME EQUIVALENTS - HOUSE ADMINISTRATION
2004-2005 CAPITAL
PROJECTS
Financial results subject to minor revisions.
|
Planned Versus Actual Spending by Authority
|
(in thousands of dollars)
|
2004-2005
|
|
|
Vote
|
|
Main Estimates
|
Supplementary Estimates
and Adjustments
|
Total Authorities
|
Actual Spending
|
Variance
|
|
|
5
|
Program Expenditures
|
212,498
|
30,024
|
242,522
|
228,819
|
13,703
|
|
|
|
(S)
|
Members of the House of
Commons *
|
102,378
|
5,842
|
108,220
|
108,220
|
0
|
|
|
(S)
|
Contributions to employee
benefit plans
|
31,687
|
(2,000)
|
29,687
|
29,687
|
0
|
|
|
|
Subtotal
|
134,065
|
3,842
|
137,907
|
137,907
|
0
|
|
|
|
|
Total
|
346,563
|
33,866
|
380,429
|
366,726
|
13,703
|
|
* Salaries and allowances
of House Officers and Members of the House of Commons
under the Parliament
of Canada Act and contributions to the Members
of Parliament Retiring Allowances Account and the
Members of Parliament Retirement Compensation
Arrangements Account
|
Planned Versus Actual Spending by Program Activity
|
(in thousands of dollars)
|
2004-2005
|
|
|
|
Program Activity
|
Main Estimates
|
Supplementary Estimates
and Adjustments
|
Total Authorities
|
Actual Spending
|
Variance
|
|
|
Members and House Officers
|
204,164
|
23,506
|
227,670
|
217,336
|
|
|
|
|
House Administration
|
|
|
|
|
|
|
|
|
Procedural Services
|
17,583
|
1,748
|
19,331
|
17,832
|
1,499
|
|

|
Office of the Law Clerk and
Parliamentary Counsel
|
2,139
|
211
|
2,350
|
2,348
|
2
|
|
|
|
Information Services
Directorate
|
34,088
|
5,594
|
39,682
|
39,516
|
166
|
|
|
|
Parliamentary Precinct
Services
|
35,700
|
3,306
|
39,006
|
38,420
|
586
|
|
|
|
Corporate Services
|
21,202
|
1,501
|
22,703
|
21,587
|
1,116
|
|
|
|
Subtotal
|
110,712
|
12,360
|
123,072
|
119,703
|
3,369
|
|
|
|
|
Contributions to employee
benefit plans
|
31,687
|
(2,000)
|
29,687
|
29,687
|
0
|
|
|
|
Total
|
346,563
|
33,866
|
380,429
|
366,726
|
13,703
|
|
|
2004-2005 Actual Spending by Service (by
percentage)
|
|
|
|
|


|

|


|
|
Increase in Main Estimates Over Previous Year
|
(in thousands of dollars)
|
Main Estimates
|
|
|
Vote
|
2004-2005
|
2003-2004
|
Variance
|
|
|
5
|
Program expenditures:
|
|
|
|

|
Members and House
Officers
|
101,786
|
96,139
|
5,647
|
|
|
|
|
Procedural Services
|
17,583
|
16,137
|
1,446
|
|
|
|
|
Office of the Law Clerk and
Parliamentary Counsel
|
2,139
|
2,130
|
9
|
|
|
|
|
Information Services
Directorate
|
34,088
|
33,206
|
882
|
|
|
|
|
Parliamentary Precinct
Services
|
35,700
|
35,449
|
251
|
|
|
|
|
Corporate Services
|
21,202
|
22,454
|
(1,252)
|
|
|
|
|
Subtotal
|
212,498
|
205,515
|
6,983
|
|
|
|
(S)
|
Members and House
Officers
|
102,378
|
90,586
|
11,792
|
|
|
(S)
|
Contributions to employee
benefit plans
|
31,687
|
28,686
|
3,001
|
|
|
|
Subtotal
|
134,065
|
119,272
|
14,793
|
|
|
|
|
Total
|
346,563
|
324,787
|
21,776
|
|
|
Full Time Equivalents - House Administration
|
|
|
Main Estimates
|
|
|
Program
Sub-activity
|
2004-2005
|
2003-2004
|
|
|
Procedural Services
|
196
|
174
|
|
|
Office of the Law Clerk and
Parliamentary Counsel
|
21
|
22
|
|
|
Information Services
Directorate
|
471
|
452
|
|
|
Parliamentary Precinct
Services
|
697
|
697
|
|
|
Corporate Services
|
300
|
299
|
|
|
Total
|
1,685
|
1,644
|
|
|
2004-2005 Capital Projects
|
(in thousands of dollars)
|
|
|
List of
Projects
|
Actual
Spending
|
Duration
|
Completion
Date
|
|
|
Computer Systems Replacement
and Software Upgrade for Members and House
Officers
|
2,006
|
1 year
|
2005
|
|
|
Replacement of Members' and
House Officers' Printers
|
994
|
1 year
|
2005
|
|
|
Total
|
3,000
|
|
|
|
|


