INDU Committee Report
If you have any questions or comments regarding the accessibility of this publication, please contact us at accessible@parl.gc.ca.
CHAPTER 1:
OVERVIEW OF THE CANADIAN ECONOMY
WORLD ECONOMIC TRENDS
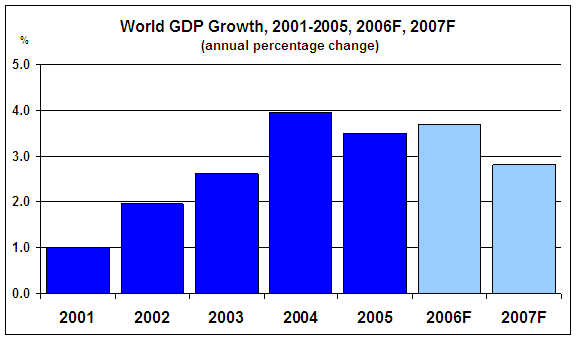
World economic activity expanded throughout the 2000-2006 period. The pace of this growth has been increasing remarkably, accelerating from a low of 1% in 2001 to a high of just short of 4% in 2004, before settling back in the 3% to 4% range for 2005 and 2006 (see Figure 1). Southeast Asia, China and India have been a large part of the story behind this outstanding performance. The Chinese economy grew by 9% per year, on average, between 2003 and 2005, while the Indian economy grew by 7% per year, on average, in the same period.[1]
Source: Conference Board of Canada
The outlook for the world economy in the second half of 2006 and 2007 is expected largely to reflect developments in the United States and, once again, China and India. Market analysts are expecting all three of these economies to grow more modestly: the United States because of weaker consumer spending and a sharp (negative) correction in housing markets, and China and India since both countries' central banks have recently raised their policy interest rates and have allowed their respective currencies (i.e., the yuan and the rupee) to appreciate in value to rein in excessive domestic growth and inflation. The Conference Board of Canada expects the world economy to expand by 3.7% in 2006, with most of the economic growth having already taken place in the first half of the year, and 2.8% in 2007. By comparison, the Bank of Canada is more optimistic, forecasting world economic growth of 5.1% and 4.7% in 2006 and 2007, respectively.[2] The projections of these two economic forecasters are similar when it comes to the United States and their differences lie mostly in their projections for China and Southeast Asia.
CANADIAN GROSS DOMESTIC PRODUCT AND LABOUR MARKET TRENDS
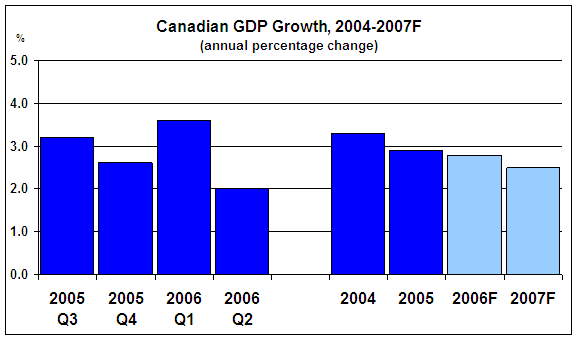
Rapid world economic expansion since 2003 has been particularly beneficial to Canada. Strong global demand for primary commodities (particularly base metals and energy) has led to high commodity prices, which, along with strong growth in final domestic demand, have fuelled robust economic growth — hovering about 3% per annum — in Canada over the past few years (see Figure 2). Indeed, the Bank of Canada judges that the Canadian economy has been operating at close to its full production capacity since the second quarter of 2004.
Source: Bank of Canada, Monetary Policy Report, October 2006.
However, between March and October 2006, the Bank of Canada lowered its forecast of Canadian output growth from 3.1% to 2.8% in 2006 and from 3.0% to 2.5% in 2007. The Governor of the Bank of Canada explains this revision in the following way:
After several years of strong expansion, the U.S. economy is cooling down, restrained by a pullback in the housing sector and slowing demand for automobiles. After growing at a 5.6% annual rate in the first quarter, U.S. economic growth slowed to just 2.9% in the second quarter, and may well have slowed to less than 2% in the third quarter of 2006.
We are expecting 3.3% growth for 2006 overall in the U.S. economy, 2.6% growth in 2007, and 3.2% in 2008.[3]
Thus, Canada's economic performance for the second half of 2006 and throughout 2007 is expected to be tied closely to developments in the United States, with the latter marginally outperforming the former.
Employment and Unemployment Rates in Canada, 2003-2006
Source: Statistics Canada, Labour Force Information, Catalogue 71-001-XIE, 1 December 2006.
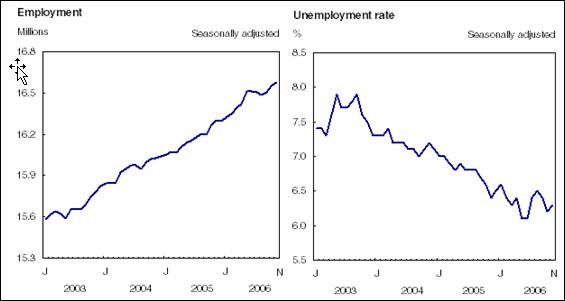
With Canadian GDP growing rapidly over the past few years, not surprisingly Canada's labour market has also performed well in this period. Aggregate employment grew from 15.6 million in January 2003 to 16.6 million in December 2006, thereby improving by 1 million persons or by 6.4% in four years (see Figure 3). The employment rate has also increased steadily to 63.1% in this period, setting a new all-time record in the process. Finally, the overall unemployment rate in Canada has declined since January 2003, and the unemployment rate over the past six months, including the December 2006 rate of 6.1%, has settled at a 30-year low.
ENERGY PRICES
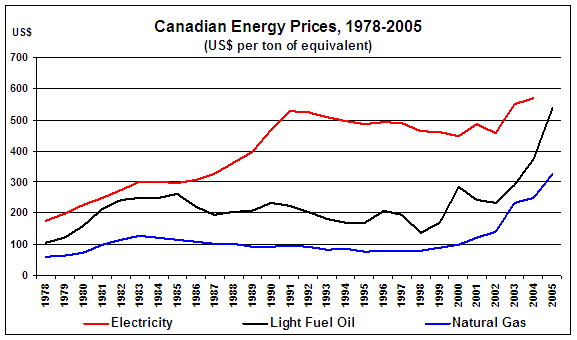
Strong global demand for primary commodities like energy, spearheaded by the Chinese, Indian and Southeast Asian "tiger" economies, has put stress on an already tight market that is manifesting itself in price increases. The world's demand and supply balance for energy began to tighten in 1998 and, subsequently, energy prices rose relatively slow at first, but they have done nothing but soar since 2000 before retreating somewhat in 2006.
Source: Natural Resources Canada and the International Energy Agency
Light fuel oil prices in Canada rose immediately and faster than all other energy forms between 1998 and 2000; since then, light fuel oil prices dipped slightly for two years before rebounding, recording an overall increase of 219% between 1998 and 2005 (see Figure 4). Natural gas prices in Canada followed light fuel oil prices. Initially, natural gas prices rose in a more restrained manner than light fuel oil prices, but since 2000 they have risen sharply and more so than for any other industrial energy source, recording an overall increase of 317% in just seven years. Electricity prices, which are somewhat constrained from responding immediately to new market conditions by provincial pricing policies, bottomed out in 1999 — one year later than for other energy sources — and have risen by a relatively more modest rate of 24% between 1999 and 2004.
The International Energy Agency (IEA) foresees a moderation of recent energy price hikes. The IEA projects world primary energy demand to expand by more than 50% between 2005 and 2030, averaging 1.6% growth per annum. Under this scenario, the world will be consuming 16.3 billion tonnes of oil equivalent (toe) by 2030 — 5.5 billion toe more than in 2005. More than two-thirds of the growth in world energy consumption is expected to come from developing countries, where economic and population growth is highest. The IEA forecasts member country crude oil import prices to decline to about US$35 per barrel by 2010 (in constant 2004 U.S. dollars) as new crude oil production and refining capacity are expected to come on stream. Thereafter, the IEA forecasts crude oil prices to rise slowly to US$37 in 2020 and US$39 in 2030 (in constant 2004 U.S. dollars). In nominal terms (i.e., without discounting for inflation or accounting for the loss in purchasing power), the price of crude oil is expected to reach US$65 per barrel in 2030.
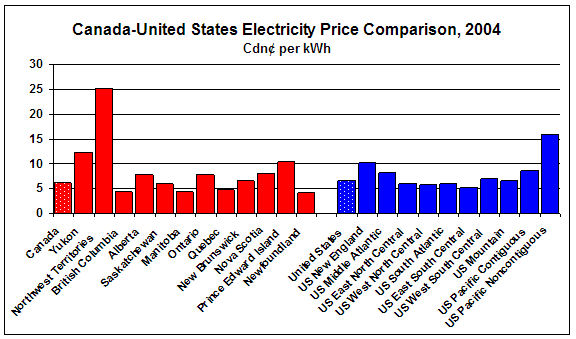
Globalization has been a force for economic convergence, particularly in terms of energy prices. Indeed, while energy prices have skyrocketed worldwide (not just in Canada) and thus do not appear at first blush to have affected the relative competitiveness of Canadian manufacturing, this is not the case of electricity. Because of North American-wide free trade and deregulation in most energy sub-sectors, light fuel oil and natural gas prices differ little between Canada and the United States. These two energy forms are no longer (if they ever were) the basis of a competitive advantage in manufacturing for either country. However, electricity remains, in some cases, such a strategic factor of production.
Source: Energy Dialogue Group submission to the House of Commons Standing Committee on Industry, Science and Technology, meeting of 3 October 2006.
In 2004, the average price of industrial electricity was 6.15¢ per kilowatt hour (kWh) in Canada and 6.65¢ in the United States (see Figure 5). However, because of the location of each country's manufacturing heartland, this 0.5¢ per kWh or 7.5% lower electricity price does not necessarily provide a competitive advantage for Canadian manufacturers relative to U.S. manufacturers. Canada's manufacturing sector lies predominantly in Ontario and Quebec (See Appendices A and B), whereas its American counterpart lies predominantly in U.S. Middle Atlantic states — New Jersey, New York and Pennsylvania — and in U.S. East North Central states — Illinois, Indiana, Michigan, Ohio and Wisconsin. In 2004, the average price of industrial electricity was 7.75¢ per kWh in Ontario, 4.77¢ in Quebec, 8.26¢ in U.S. Middle Atlantic states and 6.05¢ in U.S. East North Central states. Although Ontario manufacturers have a 0.5¢ per kWh or a 6.2% lower price for electricity as a basis for a competitive advantage over U.S. Middle Atlantic manufacturers, U.S. East North Central manufacturers have a 1.7¢ per kWh or a 22% lower price for electricity as the basis for a competitive advantage over Ontario manufacturers.[4] Since U.S. manufacturers that are highly dependent on electricity as a source of energy are likely to locate in U.S. East North Central states, a significant percentage of the U.S. manufacturing sector has a competitive advantage over Canadian manufacturers. Quebec manufacturers, however, have a 1.28¢ per kWh or a 21.2% lower price for electricity than U.S. East North Central manufacturers, thereby providing Quebec manufacturers with a competitive advantage over all U.S. regions. National statistics mask considerable regional differences, and these disparities appear to be growing with the recent spike in energy prices.
THE TERMS OF TRADE AND THE CANADIAN DOLLAR
Emerging economies such as China and India are a significant source of demand for primary commodities and considerably higher Canadian commodity export prices. At the same time, these countries are proving to be an increasing source of competition in a number of industrial and consumer goods and substantially reduced prices for Canadian merchandise imports. Emerging economies are thus both a boon and a bane to the Canadian economy, and nowhere is this more evident than in Canada's terms of trade — that is, in the ratio of Canadian export-to-import prices.
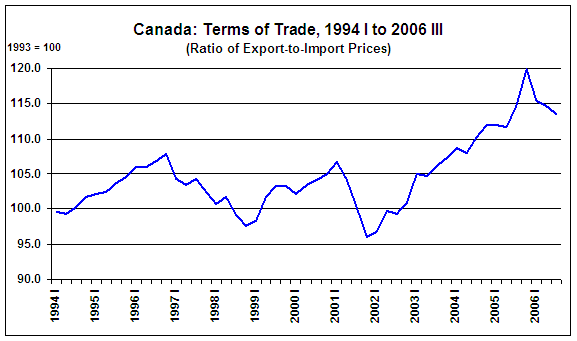
Canada's terms of trade has marked three spikes and two troughs in the past 12 years and is headed towards a third trough, but the trend is definitely up for the period as a whole (see Figure 6). The most immediate cycle began in the fourth quarter of 2001 when it rose from its (1993 100-base) index of 96.1 to 119.9 in the fourth quarter of 2005, representing a 24.8% increase in just four years. By contrast, the most significant previous spike began when this index was 99.3 in the second quarter of 1994 until it reached 107.8 in the fourth quarter of 1996. This terms-of-trade spike amounted to an increase of just 8.6% and lasted for two and a half years. As such, the data suggest that the past four years have been witness to unprecedented and abrupt change in Canadian trade terms — one might even say that Canada is experiencing a positive external shock.
This improvement in Canada's terms of trade has increased real wealth and income in the country, and has fuelled increased spending by consumers, governments, and businesses — the outcome of which is found in rapidly growing gross national expenditure (GNE) and is, in turn, the source of Canada's recent high GDP growth rate (see Figure 2).
Source: Bank of Canada and Statistics Canada
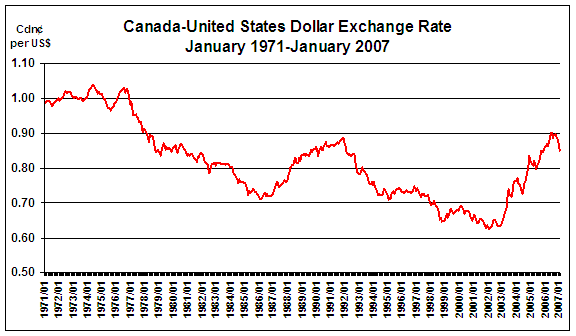
A further outcome of this terms-of-trade spike has been a rapid and substantial appreciation of the Canadian dollar against the U.S. dollar and, indeed, against many other currencies. The Canadian dollar has surged in value by 43.7% relative to the U.S. dollar in just four years (see Figure 7).[5] The Canadian dollar has also surged in value relative to the Canadian-dollar effective exchange rate Index (CERI) from 79.75 in January 2002 to 109.51 in September 2006, representing an increase of 37.3% in four and a half years.[6] Of course, this currency performance is not uniquely a Canadian story. Another contributing factor has been currency traders' concerns over both the large U.S. current account deficit and the country's growing tendency to borrow in foreign markets to finance its federal government budget deficit.
The stronger Canadian dollar has tempered the pressure of increased domestic spending on aggregate demand by dampening net exports, thus helping to put Canada's receipts and payments with other countries into better balance, equilibrate supply with demand, and keep inflation in check. At the aggregate level, Canada's flexible currency exchange rate has been playing its classic role of "shock absorber."
Also at the aggregate level, the combined effect of a large and sustained terms-of-trade shock and a substantial and protracted change in the currency exchange rate triggered a shift of resources to activities generating higher income (as it often does). Postponing adjustment would, therefore, mean forgoing potential income gains that the reallocation of resources can bring. To make the most of Canada's opportunities as a trading nation, Canadian businesses need to adjust as quickly and as effectively as possible to changes in global economic circumstances. Thus, at the industrial sector level, significant shifts in production and employment among sectors of the economy mean job losses in some industries and job gains in others. According to the "Dutch Disease" hypothesis, an increase in revenues from natural resources deindustrializes a nation's economy by raising the exchange rate, thus making the manufacturing sector less competitive. Furthermore, at the regional or provincial level, this shift can cause dislocations.
CANADIAN TRADE, COMPETITIVENESS AND PRODUCTIVITY
The immediate and most obvious impact of a rapidly appreciating Canadian dollar is found in Canada's merchandise trade account. Canada's current merchandise trade surplus with the rest of the world could be expected to decline and, if currency conditions persist, could (theoretically) even turn to deficit. In the medium term, Canadian competitiveness might languish, with productivity improvements largely stemming from the closure and shut down of relatively inefficient plants and facilities, which also tend to be of a lower productivity vintage than others within their respective industries, and employee layoffs. Limited to these types of gains, aggregate labour productivity growth could also be expected to stall for a time. In the longer term, however, the shift towards higher valued output and activities generating higher income brought about by the recent positive terms-of-trade shock are expected to ultimately lead to greater corporate profits and investment of all sorts, not the least of which includes productivity-improving machinery and equipment. Indeed, since much machinery and equipment in Canada is foreign sourced, the high value of the Canadian dollar may promote renewed investment in this area. Productivity growth and industry competitiveness would then be expected to rebound fairly quickly.
Data supporting this projected downturn and eventual turnaround are already being generated by statisticians. Beginning with the trade data, after peaking at $71 billion in 2001, Canada's merchandise trade surplus hovered about $60 billion between 2002 and 2005 and, using simple projections to the end of this year (Canada's trade surplus was $49.9 billion for the first 11 months of 2006), will decline further to $55 billion in 2006.[7] Statistics Canada has noted a trend in the composition of this trade:
In 2001, the trade surplus was rising because of gains in five of the seven largest sectors: consumer goods, autos, forestry, food and machinery and equipment. Now, the surplus is being sustained by gains in just two sectors, energy and industrial goods. … The surplus in energy surpassed forestry for the first time ever in 2001, and by last year was nearly twice as large at $53 billion. Rising commodity prices have also pushed the surplus for industrial goods to a record high so far in 2006. … Fuelled by the income generated from the commodity boom, consumers and businesses in Canada have gone on a spending spree. This has sent the deficit in consumer goods to new highs, while the deficit for machinery and equipment was the largest so far this decade.[8]
The trade data also show the emergence of China on the Canadian trade scene (see Table 1). With Canadian imports from China reaching $24.9 billion in the first nine months of 2006, up 17.2% from the same period in the previous year and more than the combined value from third and fourth place Japan and Mexico, China is Canada's second largest supplier of imported goods. Chinese products showing the greatest gains in the past year include consumer goods, such as apparel and footwear, as well as toys and house furnishings. By the same token, Canada exported $6.6 billion in merchandise goods to China in 2005, making China Canada's fourth largest export market. Exports for the first 11 months of 2006 amounted to $6.3 billion, up by about $200 million from the same period in 2005.
Canada-China Merchandise Trade, 2001-2005
(millions of dollars)
| 2001 | 2002 | 2003 | 2004 | 2005 | 2006* | |
| Exports | 3,952.5 | 3,636.9 | 3,853.1 | 6,041.5 | 6,598.3 | 6,262.5 |
| Imports | 12,721.5 | 15,999.1 | 18,569.5 | 24,009.9 | 29,477.4 | 31,690.5 |
| Balance | -8,769.0 | -12,362.2 | -14,716.4 | -17,968.4 | -22,879.1 | -25,428.0 |
* 11 months only
Source: Statistics Canada, Canadian International Merchandise Trade, Catalogue No. 65-001-XIB
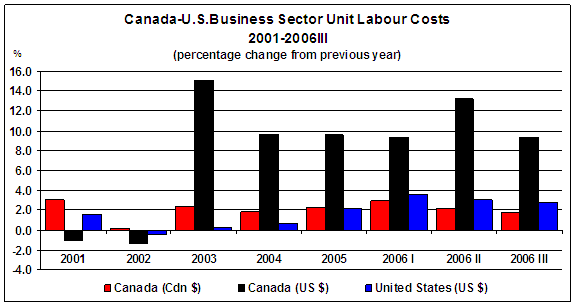
Canada's relative cost-competitiveness with the United States has demonstratively plummeted in the past three and a half years (see Figure 8). Unit labour cost increases across Canada's business sector averaged 1.9% per annum between 2001 and the first nine months of 2006. When viewed strictly in one's domestic currency, this performance is not out of line with unit labour cost increases in the U.S. business sector which averaged 1.1% per annum in the same period. Given the appreciating value of the Canadian dollar, however, unit labour costs across Canada's business sector valued in U.S. dollars increased, on average, by 6.6% per year between 2001 and the first nine months of 2006 — six times that of the U.S. business sector.
Source: Statistics Canada, The Daily: Labour Productivity, Hourly Compensation and Unit Labour Cost, 13 September 2006, http://www.statcan.ca/Daily/English/060913/d060913a.htm
Canada's competitiveness with the United States has clearly deteriorated in the first half of the first decade of the millennium. Canada's relative performance was absolutely the worst in 2003 and it appears to have improved somewhat in 2004, but this improvement has since stalled. Given the apparent recent stability of the Canadian dollar in the US85-90¢ range, then either Canadian wages must show more restraint, and/or growth in labour productivity must be much larger than in the United States if stronger Canadian business sector competitiveness with that of the United States is to be restored relatively soon.
However, Canada's tight labour market — with an unemployment rate at a 30‑year low — and the appearance of labour shortages in selected regions and industries make it less likely that wage restraint will be the principal strategic path chosen by the Canadian business sector. Instead, Canadian businesses will likely turn to greater investment in R&D, productivity-improving machinery and equipment, and other innovation strategies to raise their labour productivity in order to revitalize their competitiveness profile. The data clearly point to such a path.
In the aftermath of the ICT investment bubble, which began in the late 1990s, Canadian investment in machinery and equipment bottomed out only in 2002. Since 2003, the Canadian business sector's investment in machinery and equipment has rebounded, with annual growth approaching 8% in the second year of the upturn.[9] The impact of this nascent investment boom is already showing up in labour productivity data (see Figure 9). The Canadian business sector's labour productivity growth rate averaged 1.6% per year or about 85% of that of the U.S. business sector preceding the recent surge in the Canadian dollar (i.e., from 1981 to 2000). With the Canadian dollar soaring from US62¢ in early 2001 to US83¢ by late 2004, the Canadian business sector's labour productivity growth rate averaged only 0.7% per year or about 21% of that of the U.S. business sector. The job dislocations taking place during this period (and in response to the terms-of-trade shock) did little for labour productivity in Canada. However, since 2005, the Canadian business sector has improved its performance against its American counterpart in terms of labour productivity growth; in the first nine months of 2006, Canadian business sector labour productivity growth was 80% that of the U.S. business sector.
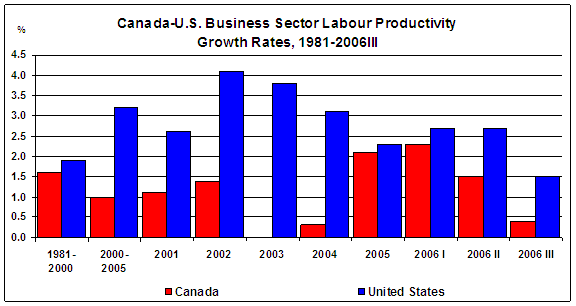
Source: Statistics Canada, Labour Productivity, Hourly Compensation and Unit Labour Cost, Second Quarter 2006,
http://www.statcan.ca/english/freepub/13-010-XIE/2006002/productivity2006002.htm
Labour productivity levels, rather than their growth rates, show a similar, but not identical, story: the recent decline and stabilization of Canadian productivity without a rebound (see Figure 10). For a rebound to occur, Canada will need to post better productivity growth performances than those recorded in 2006. Canada's business sector averaged a productivity level equivalent to 82.2% of that of the U.S. business sector throughout the 1990s and just before the terms-of-trade shock beginning in early 2002. Since then, the Canadian business sector's productivity level relative to that of the U.S. business sector declined and appears to have stabilized at an all-time low of 73.6%.
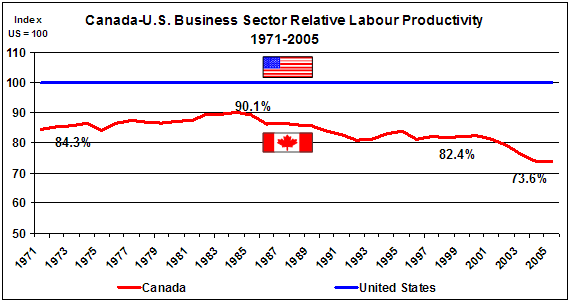
Source: Canadian Centre for the Study of Living Standards, Aggregate Income and Productivity Trends, Canada vs United States, Table 7a, http://www.csls.ca/data/ipt2006.pdf
[1] The Conference Board of Canada, World Outlook Autumn 2006, 2006, and Consensus Economics.
[2] Bank of Canada, Monetary Policy Report, October 2006, p. 24.
[3] Remarks by David Dodge, Governor of the Bank of Canada to the 2006 Ontario Economic Leadership Summit, Niagara-on-the-Lake, Ontario, 25 October 2006. http://www.bankofcanada.ca/en/speeches/2006/sp06-16.html.
[4] The disparity in electricity prices between Ontario and U.S. East North Central states increases when viewed on an individual state basis.
[5] The comparison is made between the base case (denominator) of 62.7¢ in February 2002 and of 90.1¢ on 1 May 2006.
[6] The Canadian-dollar effective exchange rate index (CERI) is a weighted average of bilateral exchange rates for the Canadian dollar against the currencies of Canada's major trading partners: U.S. dollar, 76.2%, Euro, 9.3%, Japanese yen, 5.3%, Chinese yuan, 3.3%, Mexican peso, 3.2%, and British pound, 2.7%.
[7] Statistics Canada, Canadian Economic Observer, Vol. 19, no. 11 (11-010-XIB), Table 1, p. 20.
[8] Statistics Canada, The Daily, The Changing Composition of the Merchandise Trade Surplus, 9 November 2006, http://www.statcan.ca/Daily/English/061109/d061109c.htm.
[9] Phillip Cross, "Long-run Cycles in Business Investment" in Canadian Economic Observer, Statistics Canada, Catalogue 11-010, September 2005.
